Lake Eildon’s current state
Lake Eildon was at 91.2 per cent as of 12pm, 29 April 2024.
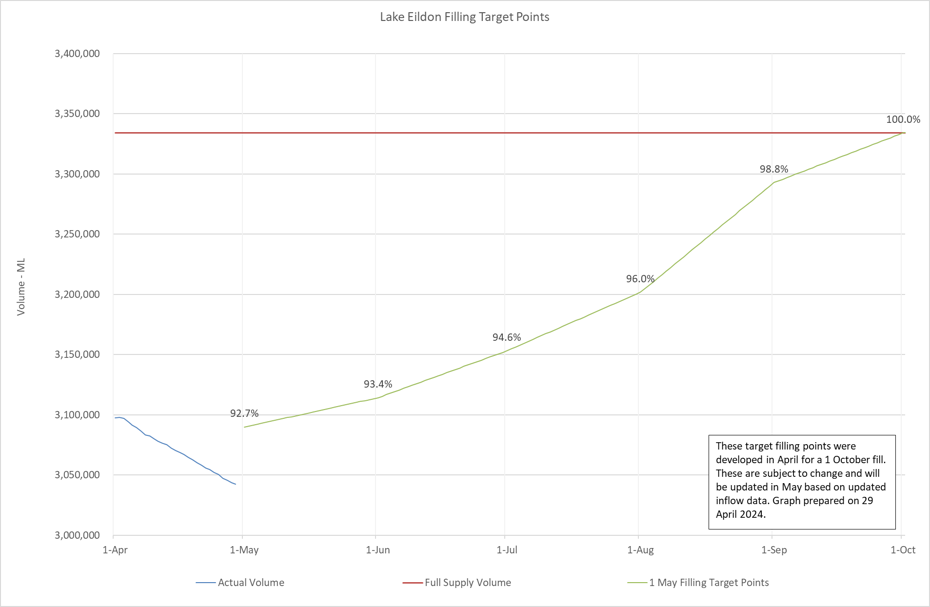
A graph showing the filling target points for Lake Eildon, with a red line showing the full supply volume, a green line showing the 95% probability of exceedance for a 1 October fill, and a blue line showing the actual volume of Lake Eildon.
Updates to daily release plans can be found under the Lake Eildon drop down on the Managing Water Storages webpage
How Eildon is being managed
The framework set out under the Victorian Water Act 1989 requires target filling points to be set from May to October so that Lake Eildon will reach full capacity with inflows that would be expected in 95 years out of 100 (i.e. it would only not fill in very dry years).
Catchment conditions, forecast inflows and expected demands are continuously monitored to inform the target filling arrangements.
As the volume of Lake Eildon is currently below the filling target, releases from the lake are being made to meet downstream demands and not to lower the storage level.
Filling targets are used between 1 May and 1 October, as historically increased demand for water and reduced inflows see storage levels decrease from October on.
During wet years, the final filling target can be adjusted to 1 November instead of 1 October. The decision to extend the target filling date to 1 November can may happen as late as September, as this allows time for actual inflows to be assessed and weather forecasts to become more reliable.
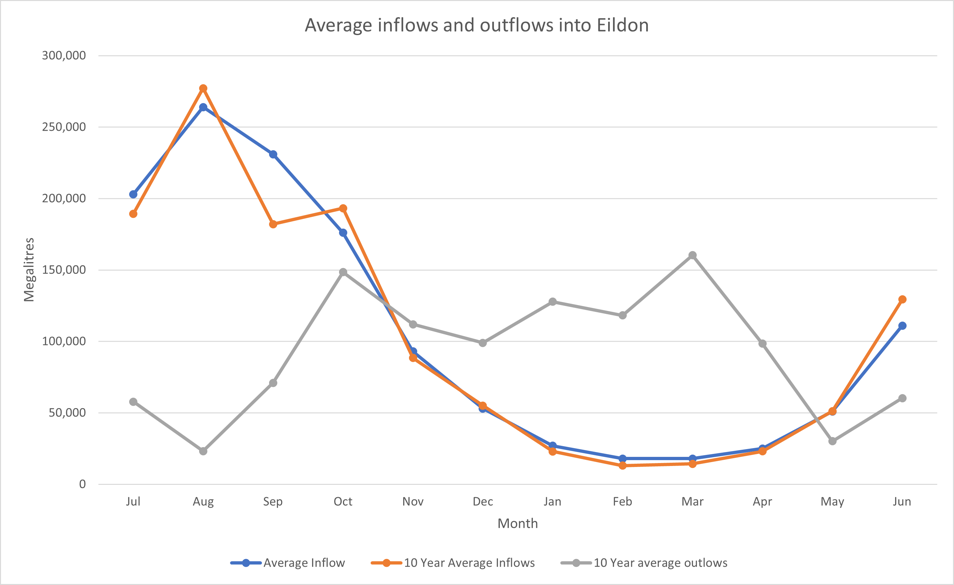
A graph showing the monthly average inflows and outflows at Lake Eildon. The average inflows since records began are shown in the blue line, the average inflows for the past 10 years are shown in the orange line, and the average outflows for the past 10 years are shown in the grey line.
Lake Eildon operating arrangements assessment
Following the October 2022 floods, the Department of Energy, Environment and Climate Action (DEECA) commissioned a technichal assessment into the operating arrangements at Lake Eildon.
A summary of this assessment can be found on the DEECA website
Lake Eildon's role in the Goulburn River catchment
 The Goulburn River Catchment, shown in the map above, has many waterways that collect water from the region. The Eildon catchment (shown in pink) is in the upper catchment of the Goulburn River and collects water from 23 per cent of the Goulburn catchment. The remaining 77 per cent of the catchment includes significant creeks and rivers like the Rubicon River, Acheron River, Yea River, Sunday Creek, Sevens Creek and the Broken River. Click the image above for a larger version.
GMW’s responsibilities
The requirements for GMW to manage its storages are set out in the Victorian Water Act.
The Act advises that the primary role of GMW storages is to harvest and store customers' water entitlements. However, GMW can provide flood mitigation benefits at some storages, including Lake Eildon, where possible.
GMW has well defined Flood Incident Management Plans for Lake Eildon should they be triggered, and work closely with the State Emergency Services (SES) and Bureau of Meteorology to ensure timely dissemination of information to the community.
The SES is the lead agency responsible for issuing flood advice should it occur.
Impact on water entitlement holders
Any releases from Lake Eildon to manage water levels will result in deductions from water entitlement holders’ spillable water accounts.
The Northern Victorian Resource Manager communicates any changes to spillable water accounts through monthly Risk of Spill announcements. These announcements are made on the 10th of each month or the next business day. To receive these announcements, subscribe to the Determinations and Outlooks on the Email Subscriptions page.
All other water entitlements will not be affected by the releases to manage water levels.
More Information
Releases are meeting normal operating requirements.
The release yesterday, today and a forecast for the next 4 days are outlined below:
Releases from Lake Eildon, megalitres per day. Last Updated: 3:45 PM 2 May 2024
| Yesterday |
1
|
May 2024 |
2,400 |
| Today |
2 |
May 2024 |
2,400 |
| Forecast |
3 |
May 2024 |
2,400* |
| Forecast |
4 |
May 2024 |
2,400*
|
| Forecast |
5 |
May 2024 |
2,400* |
| Forecast |
6 |
May 2024 |
2,400* |
*Actual releases from Lake Eildon may vary from those forecast at any time without notice.
What do changes in river flows mean for river levels?
The table below provides a summary of the river levels at various flow rates as measured at the gauges on the Goulburn River at Eildon, Trawool and Seymour.
Please note that the table below is specific for the river gauges at Eildon, Trawool and Seymour and the relationship between flows and river level will vary along the river as the profile changes.
This information does not relate to absolute water depth in the river however the table provides an indication of what various flows mean for river levels. For example, if flows increased from 5,000 ML/day to 6,000 ML/day, the river level at Trawool would increase by around 0.2 m.
Table of river levels at various flow rates as measured by the gauges on the Goulburn River at Eildon, Trawool and Seymour.
| 1,000 |
1.1 |
0.7 |
0.9 |
| 2,000 |
1.4 |
1.0 |
1.2 |
| 3,000 |
1.6 |
1.2 |
1.5 |
| 4,000 |
1.8 |
1.4 |
1.7 |
| 5,000 |
2.0 |
1.6 |
1.9 |
| 6,000 |
2.2 |
1.8 |
2.0 |
| 7,000 |
2.3 |
1.9 |
2.1 |
| 8,000 |
2.4 |
2.1 |
2.2 |
| 9,000 |
2.6 |
2.3 |
2.4 |
| 10,000 |
2.7 |
2.4 |
2.5 |
Please note: the table above provides an indication of the scale of typical river flows and flows may exceed 10,000 ML/day in response to rainfall in the catchment.
Flow and release rates for the Goulburn River system
GMW has created a simple dashboard overview of flow and release rates for the Goulburn River system from Lake Eildon to McCoys bridge since October 2022.
The inflow rate at the storage includes flows from tributaries upstream of Lake Eildon.
As well as releases from Lake Eildon, inflows from tributaries such as the Rubicon, Yea and Broken rivers and the Sugarloaf and Sevens creeks contribute to flow rates along the Goulburn River downstream of the storage.
Click on the button below to be taken to the dashboard.
Goulburn system flow and release rates dashboard
Further Information for Lake Eildon:
Tributary Flows:
There are a number of other tributaries that contribute to the river levels downstream of Lake Eildon such as the Acheron, Rubicon and Yea Rivers. Levels in these tributaries can be monitored on the Bureau of Meteorology website.
For more information visit www.gmwater.com.au/managing-storages or phone GMW on 1800 013 357.
To stay up-to-date with the latest warnings, head to the Bureau of Meteorology website: http://www.bom.gov.au/australia/warnings/
Emergency alerts and warnings will be issued by VicEmergency. Stay up-to-date at their website: emergency.vic.gov.au/respond/
Recent rainfall events
- Rainfall was widespread falling the Goulburn River catchments both above and below the dam.
- Lake Eildon inflows peaked at 145,000 ML per day.
- Outflows peaked at 38,000 ML per day. This is above moderate flood level for the Goulburn River immediately downstream of Lake Eildon, and therefore would have impacted on townships such as Molesworth despite the majority of the inflows being attenuated by the storage.
- The peak flows at Seymour were about 140,000 ML per day.
- Releases from Lake Eildon take approximately 48 hours to reach Seymour. 48 hours before the peak flows at Seymour, releases from Lake Eildon were about 12,400 ML per day, meaning Lake Eildon releases accounted for less than 10 per cent of the peak flows at Seymour. Most of the flows originated from tributaries downstream of Lake Eildon, such as Sunday and Sugarloaf creeks.
- More details on how flooding occurred in the Goulburn System in 2022 can be found on our floods in focus page: Floods in Focus: Goulburn River system - Goulburn Murray Water (g-mwater.com.au)
- The rainfall was more isolated, with most of the rain falling above Lake Eildon.
- Inflows into Lake Eildon peaked at about 120,000 ML per day.
- Outflows peaked at 17,000 ML per day. This is above minor flood level for the Goulburn River immediately downstream of Lake Eildon and would have impacted several landholders in the catchment immediately downstream of Lake Eildon.
- GMW was able to surcharge the storage to ensure releases from to minimise releases from Lake Eildon as much as possible .
- Downstream creeks and tributaries were still a significant contributor to peak levels downstream of the storage, with the peak flow at Seymour being about 28,000 ML per day, with Lake Eildon releases only contributing to about 4,500 ML per day of this peak.
- The rainfall was more isolated, with most of the rain falling below Lake Eildon.
- Inflows into Lake Eildon peaked at about 45,000 ML per day.
- Releases peaked at 7,500 ML per day, about 24 hours after the inflows peaked. This is well below the minor flood level.
- Flooding on the Goulburn River was driven by tributary flows downstream of Lake Eildon.
- The releases from Lake Eildon accounted for about 1,000 ML per day of the 66,000 ML per day peak at Seymour.
- GMW waited until peak flows downstream of the storage were receding before increasing the releases to make room for further inflows.