How the October 2022 floods occurred along the Campaspe River
Climate influences
In September 2022 the Bureau of Meteorology (BOM) declared a La Niña weather pattern for a third consecutive year – increasing the chance of above-average rainfall across the GMW region. This was only the third time an extended La Niña has occurred since records began in 1900.
Victoria’s weather this year has also been influenced by a negative Indian Ocean Dipole, which typically sees above-average winter-spring rainfall in Australia.
The weather patterns we have received have caused a wetter catchment, higher soil moisture content, and minimal water absorption, leading to increased runoff and higher river levels.
Key facts
- Lake Eppalock is a fixed crest spillway - this means water passes over the spillway crest as inflows exceed the volume of the storage.
- Lake Eppalock was 50 per cent capacity in early August. It started spilling on 30 September.
- Maximum valve pre-releases (approximately 1,800 ML/d) commenced on 3 October in anticipation of forecast rainfall to help reduce the storage level as much as possible.
- Inflows to Lake Eppalock increased rapidly on 13 October, from 25,000 ML/d to a peak of 235,000 ML/d, a new historical high.
- Flows over the spillway peaked at 103,000 ML/day on 14 October, also a new historical high.
- Estimated peak flows at Rochester were around 120,000 ML/d. Spillway flows from Lake Eppalock and downstream tributary inflows from Forest Creek, Mt Pleasant Creek and Axe Creek all contributed.
Lake Eppalock
Lake Eppalock has a fixed crest spillway. This means water passes over the spillway crest as inflows exceed the volume of the storage.
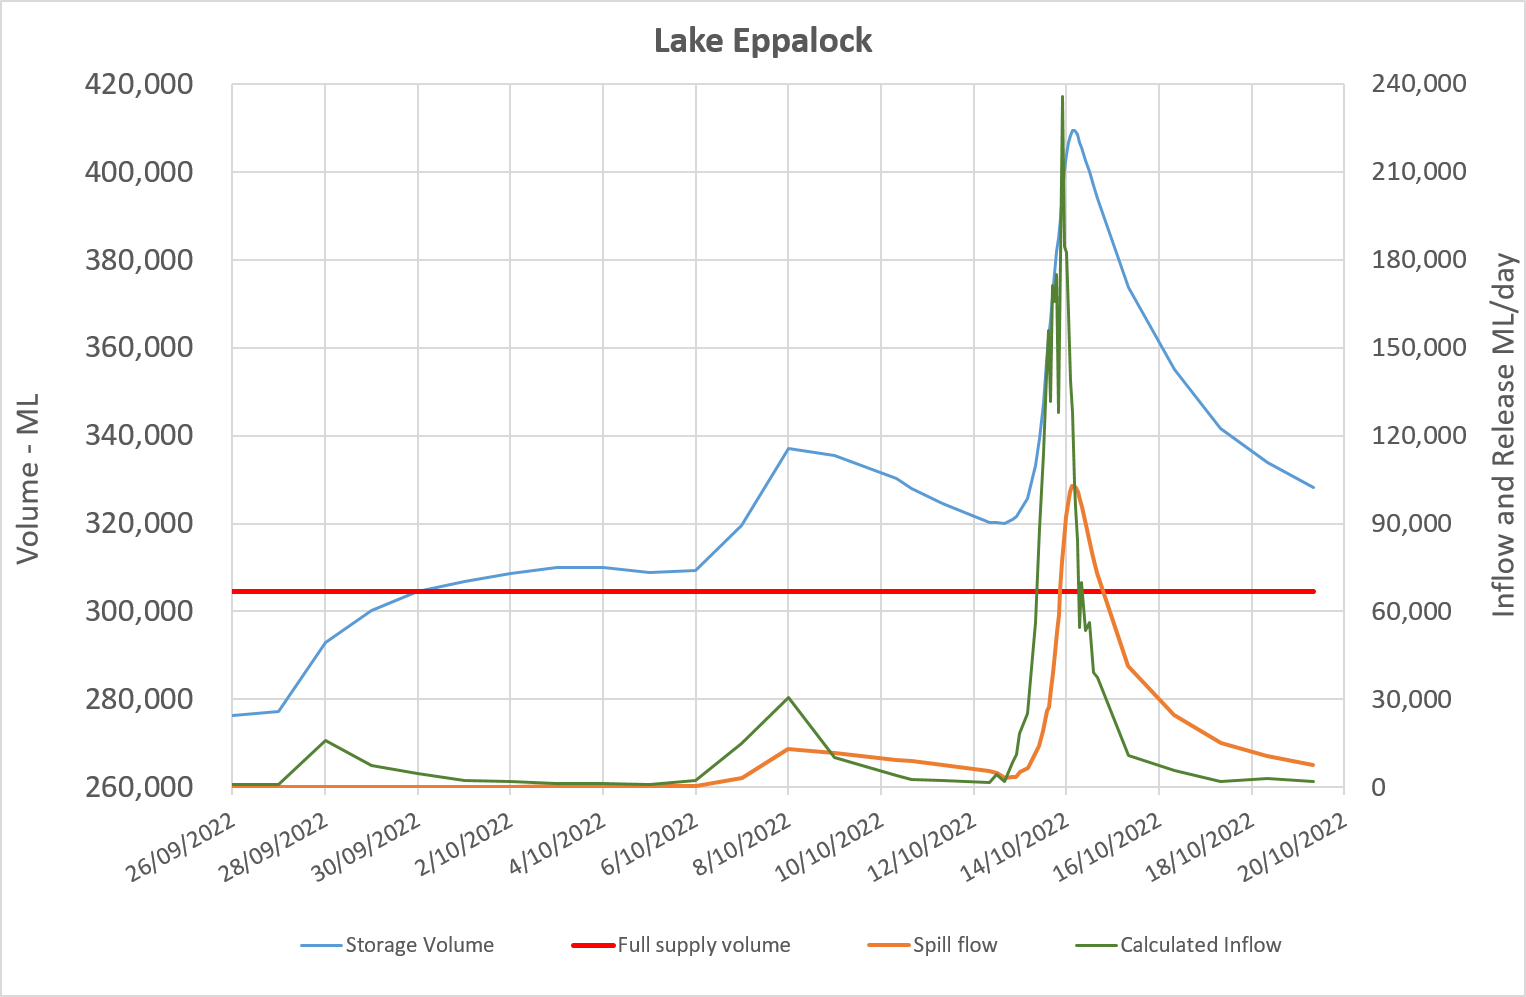
Heavy rainfall over the catchment during August and September increased the volume of water in Lake Eppalock from 50 per cent on 4 August to full supply on 30 September, resulting in the storage spilling in response to inflows (Lake Eppalock – blue line intersects with the red).
Maximum valve pre-releases (approximately 1,800 ML/d) commenced on 3 October in anticipation of forecast rainfall to help reduce the storage level as much as possible – these were on top of the spill flows already occurring.
Inflows to Lake Eppalock increased rapidly on 13 October from 25,000 ML/d to a peak of 235,000 ML/d, a new historical high (Lake Eppalock – green line). This peak inflow resulted in the storage reaching a capacity of around 134 per cent, almost three metres above the full supply level, and engaging the secondary spillway.
Flows over the spillway peaked at 103,000 ML/day on 14 October, also a new historical high. While still a large flow in the Campaspe River downstream, the spillway significantly reduced the flow from the historical peak that entered the storage from its upper catchment.

A line graph titled Lake Eppalock. The date range is 26 September to 20 October 2022. The graph provides visual representation of the volume of Lake Eppalock in megalitres using the left hand vertical axis. A red line represents full supply volume at 304,651 ML, and a blue line represents the fluctuating height of the storage in response to inflows to the storage. On 30 September the blue line crossed above the red full supply line and increased in line with inflows, peaking at capacity of approximately 410,000 megalitres on 14 October 2022.
The graph also provides a visual representation of the inflows to and releases from Lake Eppalock in megalitres per day using the right hand vertical axis. A green line represents inflows which peaked at 235,000 megalitres per day on the 13 October 2022. An orange line represents the calculated spill flow which is determined by the volume held above the full supply volume. Spill flow peaked at 103,000 megalitres per day on the 14 October 2022.
Rochester
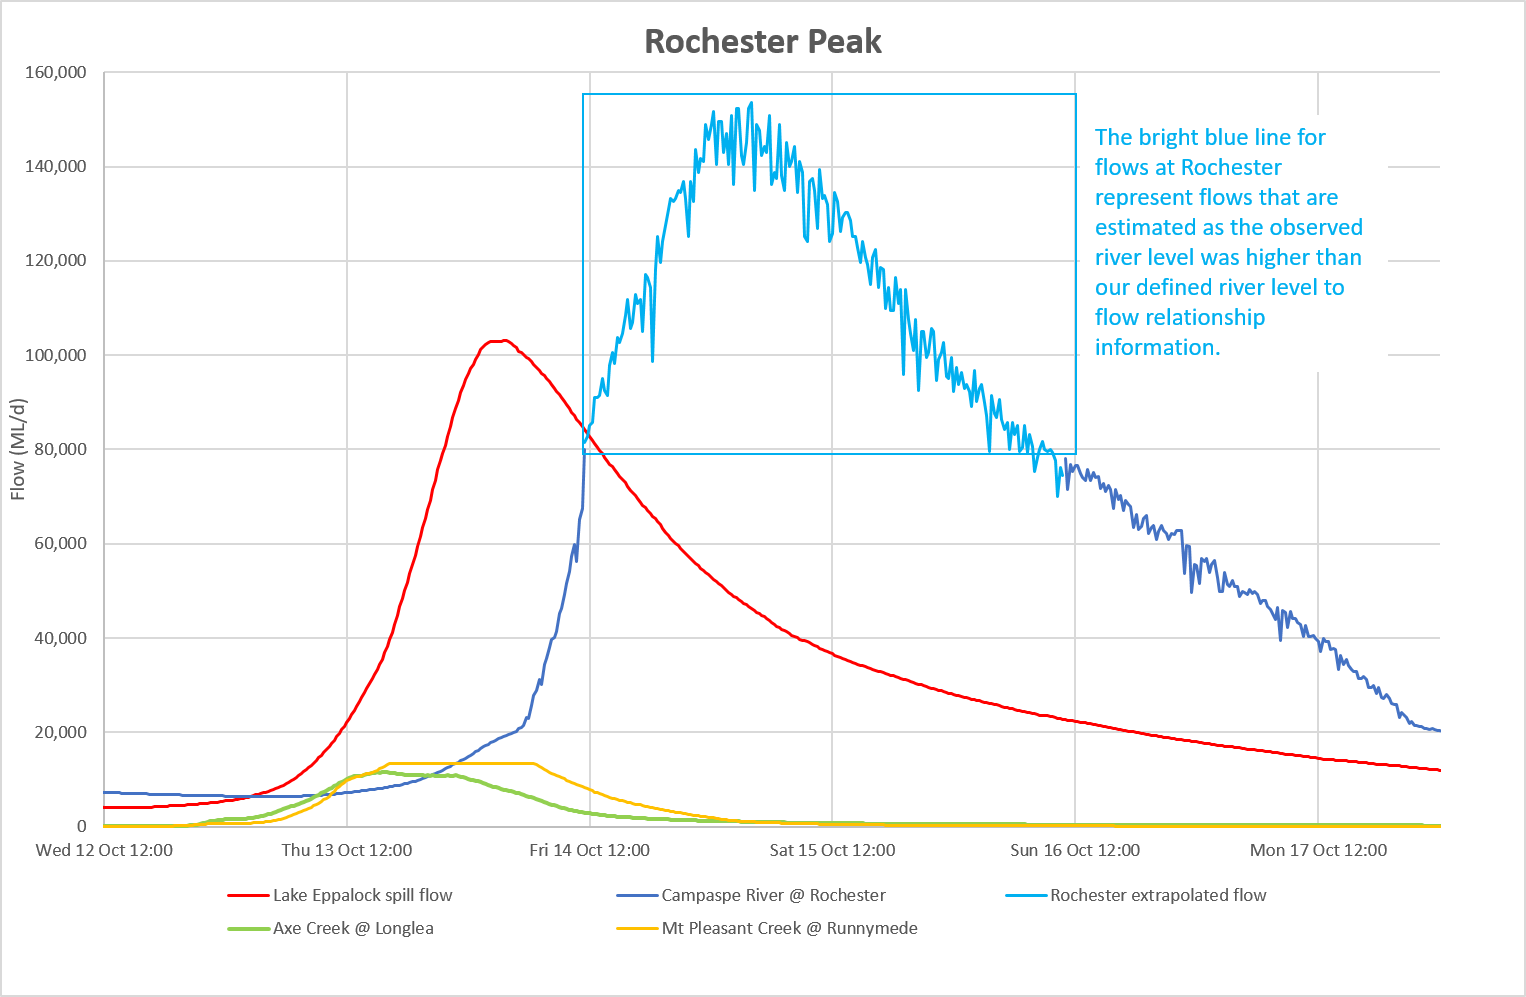
The initial rise in the Campaspe River at Rochester was driven by tributary inflows below Lake Eppalock from Forest Creek, Mt Pleasant Creek, Axe Creek and other ungauged creeks, providing additional flows of approximately 30,000 ML/d (combined) (Forrest Creek is not included in the graph as it is an unmonitored tributary).
The flows from the upper tributaries and Lake Eppalock reduced as they moved downstream, with flows spreading across the surrounding landscape. Estimated peak flows at Rochester were around 150,000 ML/d.

A line graph titled Rochester Peak. The date range is 12 to 17 October 2022. The graph provides visual representation of the flows between the Lake Eppalock spillway and Rochester in megalitres per day. A red line represents the spill flow from Lake Eppalock which peaked at 103,000 megalitres per day on 14 October 2022. Green and yellow lines represent the monitored flow of Axe Creek at Longlea and Mt Pleasant Creek at Runnymede (respectively) which flow in to the Campaspe River downstream of Lake Eppalock, these creeks both peaked at approximately 15,000 megalitres on 13 October 2022.
A dark blue line represents the flow at Rochester. Between 12noon on 14 October and early on 16 October 2022, the water level at Rochester was higher than GMW’s defined river level to flow relationship information. During this time estimated flows peaked in Rochester at around 150,000 megalitres per day, these estimated flows are represented in bright blue.
The role of GMW storages during floods
GMW’s water storages are designed and operated to provide a secure and safe water supply. They are not specifically for flood mitigation. If there is opportunity, the storages can be operated to reduce the downstream flood peak where possible.
Water storages may provide significant mitigation for small floods and may reduce downstream flooding. However, a storage’s ability to mitigate downstream flows so they remain below flood thresholds reduces as floods become larger.