How the October 2022 floods occurred along the Goulburn River
Climate influences
In September 2022 the Bureau of Meteorology (BOM) declared a La Niña weather pattern for a third consecutive year – increasing the chance of above-average rainfall across the GMW region. This was only the third time an extended La Niña has occurred since records began in 1900.
Victoria’s weather this year has also been influenced by a negative Indian Ocean Dipole, which typically sees above-average winter-spring rainfall in Australia.
The weather patterns we have received have caused a wetter catchment, higher soil moisture content, and minimal water absorption, leading to increased runoff and higher river levels.
Key facts
- Inflows to Lake Eildon peaked at 145,000 ML/day while releases were able to be maintained at a peak of 38,000 ML/day.
- The ability to minimise releases to this extent was a result of utilising the available airspace that had been maintained through strategic pre-releases.
- The peak flow at Seymour (est at 140,000 ML/day) occurred prior to the increased releases from Lake Eildon arriving at Seymour. The peak release from Lake Eildon was 38,000 ML/day release – this shows the significance of the flows from unregulated tributaries downstream of Eildon.
- The peak flow at Shepparton (est at 192,000 ML/day) was primarily made up of tributary inflows between Eildon and the Goulburn Weir, plus inflows from the Broken River and Seven Creeks.
- Releases from Lake Eildon only contributed approximately 6% of the peak experienced at Shepparton.
Lake Eildon
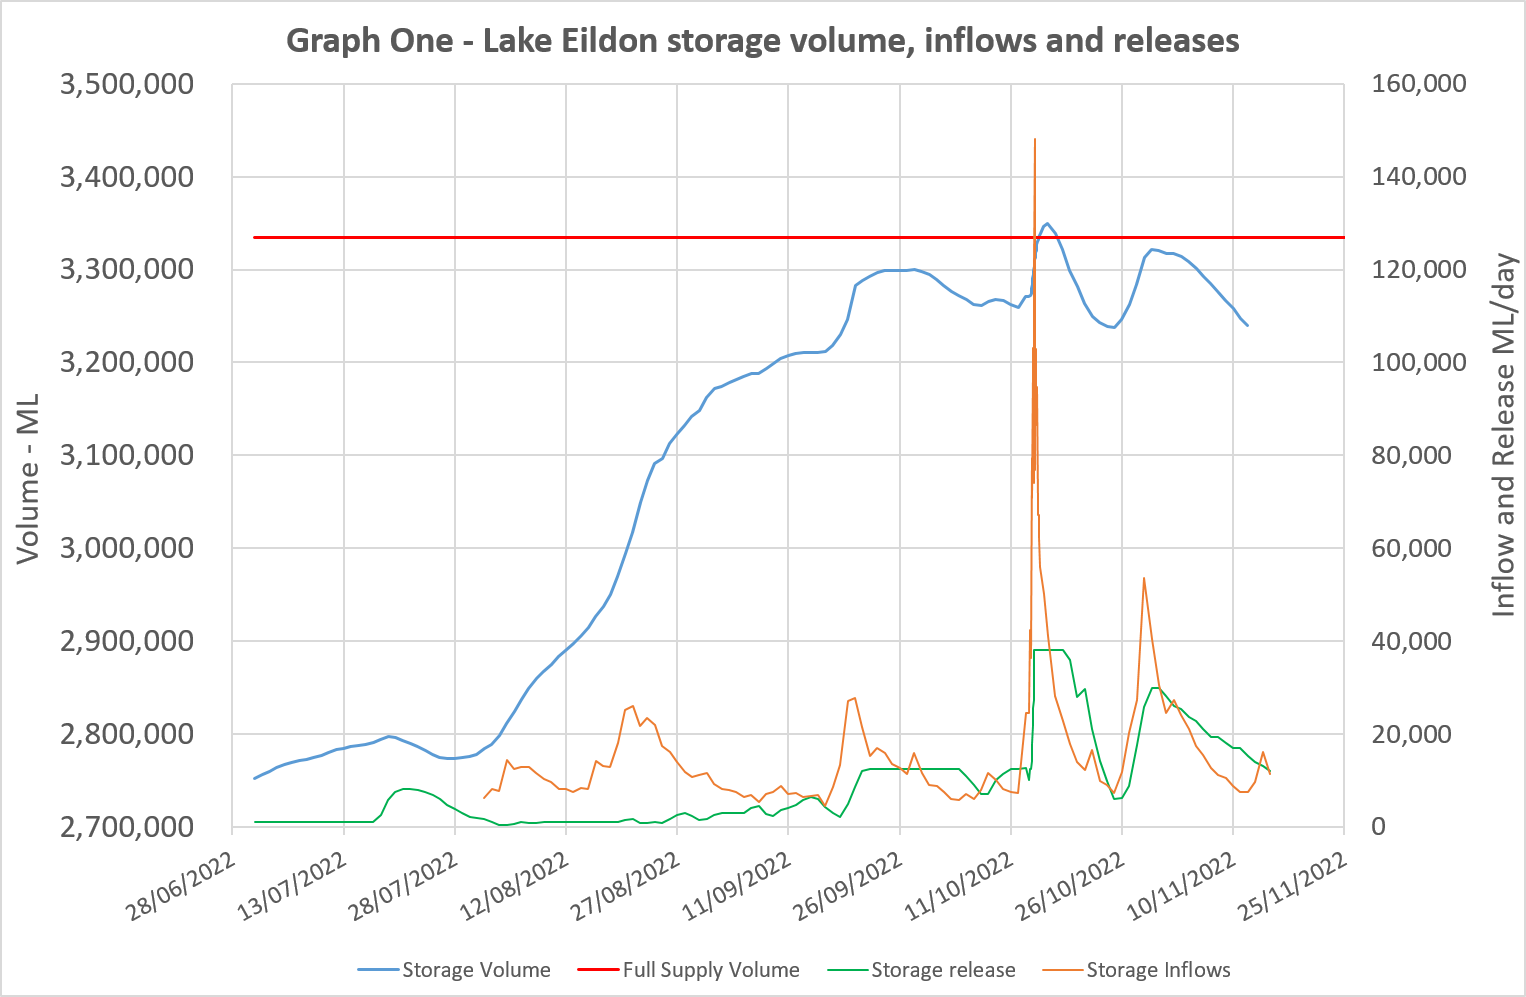
GMW began pre-releasing water through the outlet tower (power station) at Lake Eildon to manage storage levels in late August 2022 (Graph One – Storage Release). These releases were to slow the rate of rise and provide GMW with options to manage potential high inflows.
Eildon inflows increased rapidly on Thursday 13 October and were over 100,000 ML/d for an extended period, reaching a maximum rate of about 145,000 ML/d early on 14 October.
At 11 pm on 13 October, GMW increased releases from Lake Eildon using the spillway gates. This was the first time this has happened for flood operations since October 1996. Releases were increased (stepped) by 2,500 ML/hour, up to 38,000 ML/d and were maintained while the storage level rose above the full supply level.
These actions were planned to keep releases and impacts on downstream communities as low as possible.
Inflows were above 38,000 ML/d until 17 October (i.e. inflows were exceeding outflows) (Graph One – Storage Inflows).

A line graph titled Lake Eildon storage volume, inflows and releases. The date range is 28 June to 25 November 2022. The graph provides visual representation of the volume of Lake Eildon in megalitres using the left hand vertical axis. A red line represents full supply level at 3,334,000 ML, and a blue line represents the fluctuating height of the storage in response to inflows to the storage. From June, the storage volume begins to increase due to continual and fluctuating inflows. On 14 October the blue line crossed above the red full supply line, peaking at capacity of approximately 3,350,000 megalitres on 14 October 2022.
The graph also provides a visual representation of the inflows to and releases from Lake Eildon in megalitres per day using the right hand vertical axis. An orange line represents inflows which peaked at around 145,000 megalitres per day on the 14 October 2022. A green line represents the releases in response to the inflows and storage volume. Releases peaked at 38,000 megalires per day on 14 October 2022.
Seymour and the Mid-Goulburn
Inflows from Mid-Goulburn tributaries (e.g. the Acheron River, Rubicon River, Home Creek, Yea River, King Parrot Creek, Sugarloaf Creek and Hughes Creek) significantly contributed to the Goulburn River levels between Lake Eildon and Goulburn Weir.
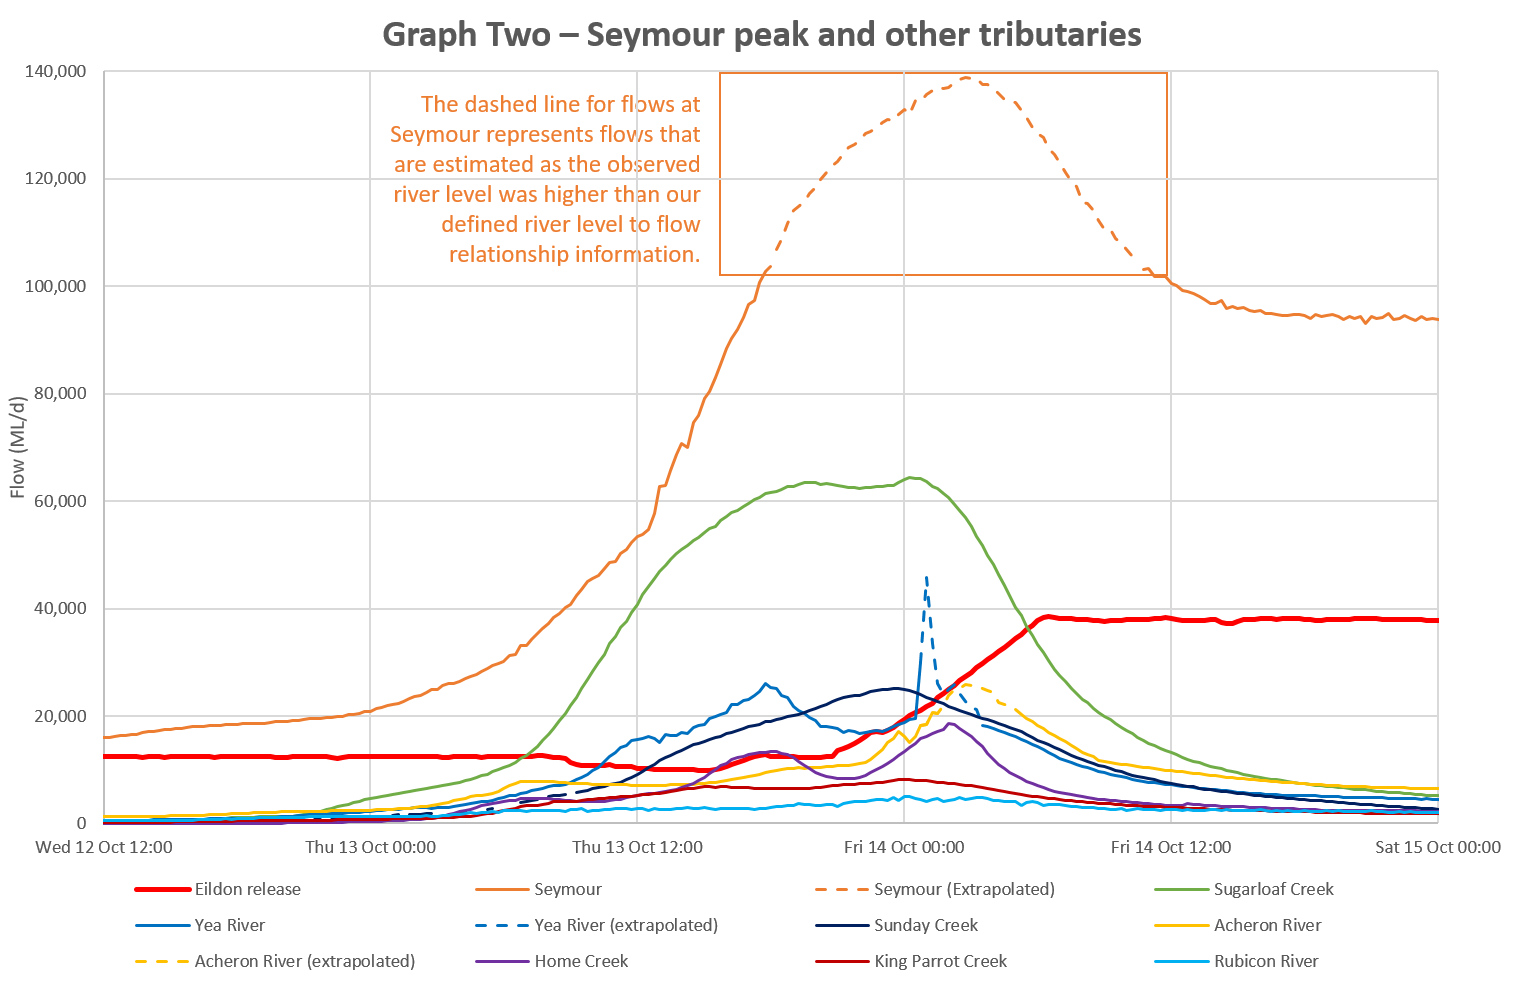
The water level at Seymour began to rise on Thursday 13 October and peaked early on Friday 14 October (Graph Two – orange line). Most of this water came from local tributaries such as the Sugarloaf and Sunday creeks. These tributaries enter the Goulburn River just upstream of Seymour.
Lake Eildon releases were increasing as water levels at Seymour peaked and flows from the downstream tributaries were decreasing. This resulted in the peak flows experienced at Seymour passing before the additional releases from Lake Eildon arrived (Graph Two – orange v red line).
As a guide, it takes about 48 hours for water released from Lake Eildon to reach Seymour. The Lake Eildon releases instead slowed the speed at which the river levels dropped

A line graph titled Seymour peak and other tributaries. The date range is 12 to 15 October 2022. The graph provides visual representation of the flows between Lake Eildon and Seymour in megalitres per day.
Green, blue, navy, yellow, purple, maroon and bright blue lines represent the monitored flow of Sugarloaf Creek, Yea River, Sunday Creek, Acheron River, Home Creek, King Parrot Creek and Rubicon River (respectively) which flow in to the Goulburn River upstream of Seymour. The green line representing Sugarloaf Creek is the largest contributor of inflows with a peak of approximately 64,000 megalitres per day on 13 and early 14 October.
An orange line represents the flow at Seymour. Between about 6pm on 13 October and noon on 14 October 2022, the water level at Seymour was higher than GMW’s defined river level to flow relationship information. During this time estimated flows peaked in Seymour at around 140,000 megalitres per day at around 3am on 14 October 2022, these estimated flows are represented by a dashed orange line.
A red line represents the releases from Lake Eildon which peaked at 38,000 megalitres per day on 14 October 2022.
Shepparton
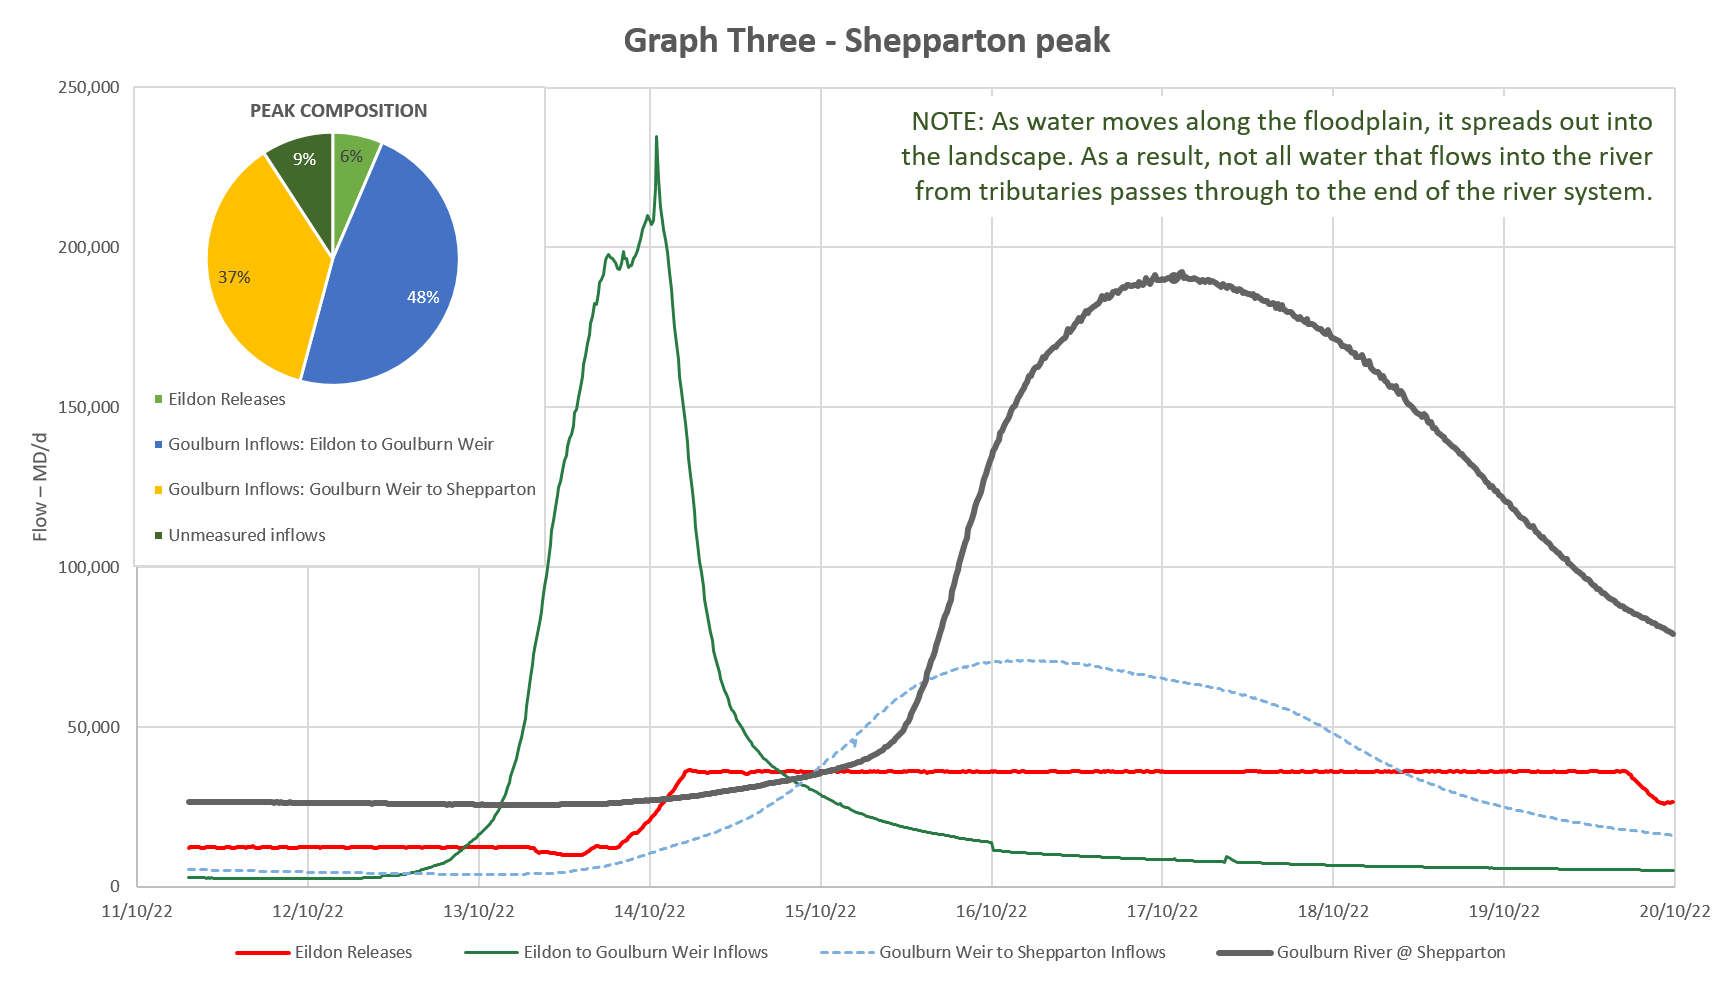
Inflows from a number of rivers and creeks contributed to the high water levels in the Goulburn River downstream of Lake Eildon, including at Seymour and in the Murchison, Mooroopna and Shepparton areas. When river levels were at their peak, releases from Lake Eildon were only a small component (Graph Three – red line and 6% of composition).
Like the peak at Seymour, there was a large volume of inflows from tributaries contributing to river heights downstream of Lake Eildon that passed through Goulburn Weir. At its peak, flows passing through Goulburn Weir were approximately 130,000 ML/d.
On Monday 17 October, the river height peaked in Shepparton. This peak was made up primarily of inflows from the unregulated Mid-Goulburn tributaries, plus the local rainfall and high flows from the Broken River and Seven Creeks entering the Goulburn River (Graph Three – Peak Composition).

A line graph titled Shepparton Peak. The date range is 11 to 20 October 2022. The graph provides visual representation of the inflows flows contributing to the Shepparton Peak in megalitres per day.
A red line represents the releases from Lake Eildon which peaked at 38,000 megalitres per day on 14 October 2022.
A green line represents the inflows between Lake Eildon and the Goulburn Weir, peaking at approximately 230,000 megalitres per day on 14 October 2022.
A dotted blue line represents the inflows between Goulburn Weir and Shepparton, peaking at approximately 70,000 megalitres per day on 16 October 2022.
A grey line represents the river height at Shepparton which peaked at approximately 180,000 megalitres per day on 17 October 2022.
Included within the graph is also a pie chart titled Peak Composition. Blue represents Eildon to Goulburn Weir inflows – 48 per cent, yellow represents Goulburn Weir to Shepparton inflows – 37 per cent, dark green represents unmeasured flows – 9 per cent, and light green represents Eildon releases – 6 per cent.
The role of GMW storages during floods
GMW’s water storages are designed and operated to provide a secure and safe water supply. They are not specifically for flood mitigation. If there is opportunity, the storages can be operated to reduce the downstream flood peak where possible.
Water storages may provide significant mitigation for small floods and may reduce downstream flooding. However, a storage’s ability to mitigate downstream flows so they remain below flood thresholds reduces as floods become larger.